
Updated 13 September 2023
While you can easily measure your heart rate by monitoring your pulse with modern technologies such as the smartwatch, an electrocardiogram (ECG) can be used to gain multiple insights into the baseline health of your heart.
- What is an ECG?
- How to determine heart rate from an ECG
- Why is heart rate important?
- What is a heart attack?
- Can and ECG tell you’re having a heart attack?
What is an ECG test?
An ECG test is one of the most basic and swift procedures for assessing the heart. It involves attaching electrodes (small, skin-sticking plastic patches) to specific areas of the chest, arms, and legs to record the electrical signals produced when your heart beats. These electrical signals are represented on an ECG as 12 leads depicting different sections of the heart.
Through these electrical signals, healthcare professionals can determine your heart rate, the presence of any rhythm disturbances, and signs that indicate a past heart attack and even suggest enlarged heart chambers.

[Image description: A person is lying down getting an ECG test done inside a clinic. They have ECG leads on their chest, arms, and legs. Next to the bed is a cardiac technician who is adjusting an electrode and reading the paper trace coming out of the ECG machine.]
Electrical currents cause the heart to contract which squeezes blood from one heart chamber to the next. An ECG records such impulses, which show how rapidly and regularly the heart beats. Specific variations on an ECG can indicate a variety of potential cardiac conditions.
Several factors can increase risk of heart disease, for instance, high blood pressure, high cholesterol, and smoking just to name a few. Individuals with increased risk, a past history of heart disease, or with a family history of heart disease may be referred to have an ECG.
Most often a person experiencing the following symptoms will be advised by their doctor to have an ECG test:
- Chest pain
- Dizziness, lightheadedness, or confusion
- Heart palpitations
- Rapid pulse
- Shortness of breath
- Weakness, fatigue, or a decline in ability to exercise
[Blog] Read the ultimate guide to the ECG test
How to determine heart rate from ECG
There are several different methods used to determine heart rate on an ECG. Below, we will take a look at three (3) methods that can be used most effectively for varying heart rhythms:
- Regular rhythms
- Fast rhythms
- Irregular rhythms
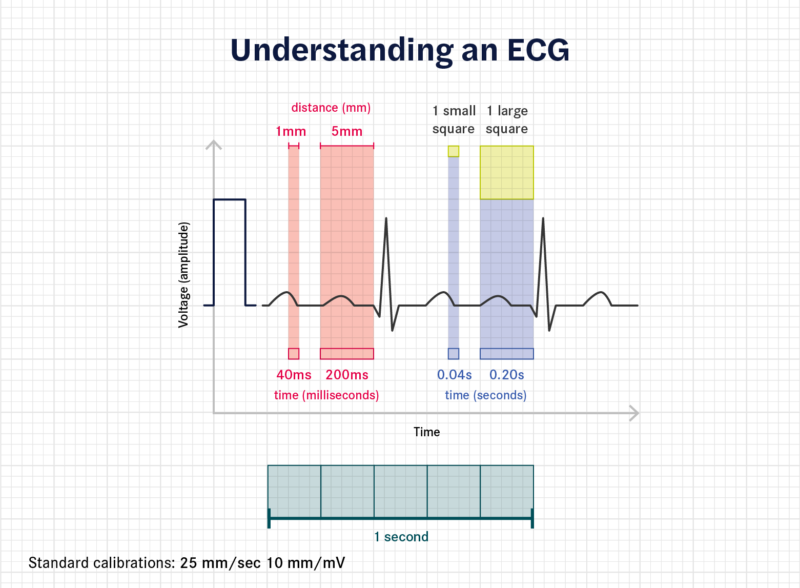
Before we explore different ways to calculate heart rate on an ECG, it is important to understand the ECG paper itself. Typically, ECG paper is set to a standard speed of 25 mm/s and a voltage of 10 mm/mV. The paper is a grid of squares that can be used to calculate heart rate.
Five large squares, when set to standard measurement, depict one (1) second. One (1) large square represents 0.2 seconds and a small square is equal to 0.04 seconds.
- 0.04 seconds x 5 small boxes = 0.2 seconds
- 0.2 seconds x 5 big boxes = 1 second
Next, it is important to understand what a heartbeat looks like on an ECG. A heartbeat is represented by a series of waves that show how the heart muscle contracts and relaxes over time. The largest deflection on an ECG is often the R wave, this represents the main muscle of the heart contracting. By identifying the R wave in each beat, we can measure the time taken between one heartbeat and the next.
Finally, heart rate is calculated in beats per minute (bpm). There are 60 seconds in 1 minute. With this, we can combine our knowledge of the ECG paper and ability to identify R waves across it, to calculate a person’s heart rate.
- 60 seconds (one minute) / 0.2 seconds (one large square) = 300
- 60 seconds (one minute) / 0.04 seconds (one small square) = 1500
The equations above will help us to estimate heart rate in the examples below.
Now that you understand the basics, let’s explore different ways to calculate heart rate.
1. Regular rhythms
For regular heart rhythms, heart rate can easily be estimated using the large squares (0.2s) on an ECG. Simply identify two consecutive R waves and count the number of large squares between them. By dividing this number into 300 (remember, this number represents one minute) we are able to calculate a person’s heart rate.
- Rate = 300 / number of large squares between consecutive R waves.
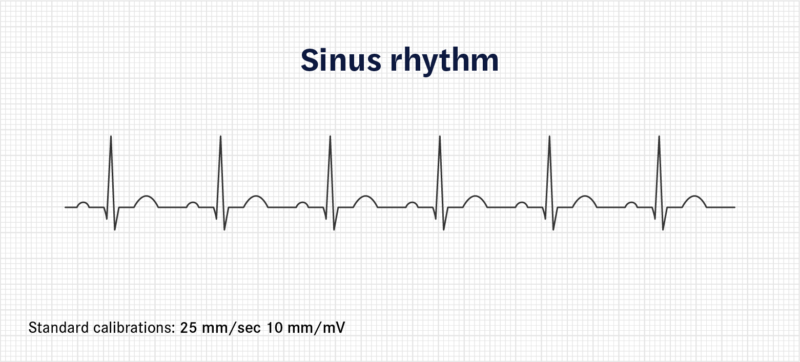
A regular rhythm
2. Fast rhythms
For fast heart rhythms, two consecutive R waves may be too close together to accurately estimate a person’s heart rate using the larger squares. In instances like this, using the smaller squares to calculate heart rate may be helpful.
Like in the example above, identify two consecutive R waves and count the number of small squares (0.04s) between them. By dividing this number into 1500 (remember, this number also represents one minute) we are able to calculate a person’s heart rate.
- Rate = 1500 / number of small squares between consecutive R waves.
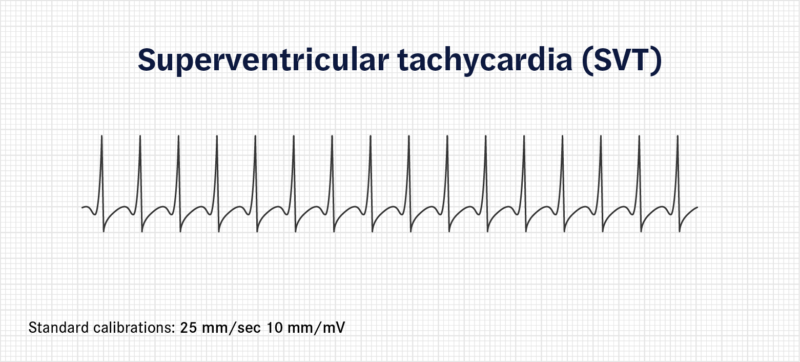
A fast rhythm is indicative of superventricular tachycardia
3. Irregular rhythms
Estimating heart rate for irregular heart rhythms presents a challenge as heartbeats are erratic and unevenly spaced apart. To combat this we can count the number of R waves over a 10 second period and multiply that number by 6. This gives us the average beats per minute (bpm) for a rhythm strip with an irregular heart rate. This method can also be used for regular rhythms.
- Rate = Number of R waves over a 10 second period x 6
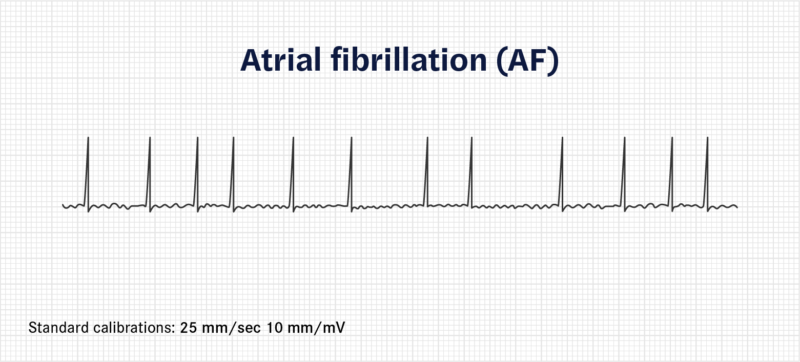
Irregular rhythms can indicate atrial fibrillation
Why is heart rate important?
A healthy adult has a heart rate that sits around 60 – 100 bpm. Maintaining a healthy heart rate is important for all bodily functions. An adequate heart rate ensures oxygen and nutrient-rich blood is delivered throughout the body whilst waste products, such as CO2, are removed.
Sometimes our heart beats faster or slower and this is often normal. However, sometimes these heart rhythms are caused by underlying issues that require attention. For example, a person may have a particularly slow heart rate. This could be because they are super fit or because there is a rhythm disturbance where beats are skipped. An ECG will allow a healthcare professional to calculate heart rate and determine if variations in your heart rate is normal or not.
What is a heart attack?
A heart attack is caused by a blockage in one of the vessels of the heart.
The most common indicator of a heart attack on an ECG is the elevation of what is known as the ST segment of a heartbeat. The ST segment represents the beginning of ventricular relaxation after contraction. When ST elevation is observed in two or more leads that look at the same section of the heart leads on a 12 lead ECG, suspicion of a heart attack is heightened.
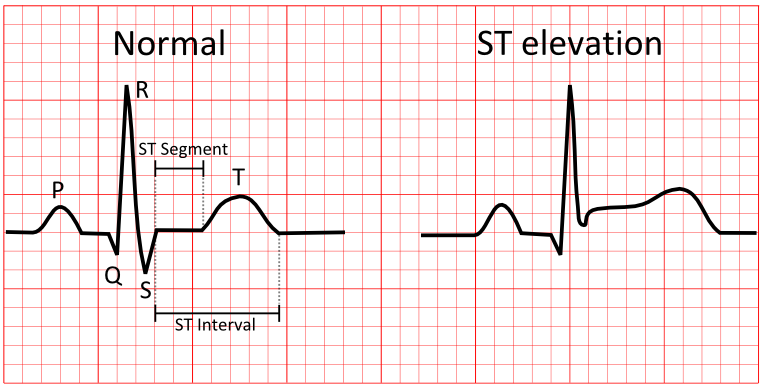
In the figure on the right, a ST elevation can be seen in the ST segment
These ECG changes will lead to a blood test that looks for a protein called troponin. An elevated troponin combined with ST elevation warrants a trip to a Cath Lab, a specialised hospital laboratory where your heart will be investigated for any blockages. However, a person experiencing chest pain with a suspicious ECG may be sent straight to a Cath lab prior to receiving blood work results.
Can an ECG tell when you are at risk of a heart attack?
Having coronary artery disease (CAD) increases the risk of having a heart attack. CAD is caused by plaque buildup in your heart vessels. Identifying symptoms of CAD early can help to prevent you ending up in the emergency department.
An ECG stress test is primarily an assessment of your heart to determine if your symptoms are caused by CAD. During the test, you will be connected to an ECG machine and asked to walk on a treadmill, while a doctor monitors your heart’s activity and takes your blood pressure at various intervals. If horizontal or down-sloping ST depression of more than 1 mm is observed on the ECG, it can raise suspicion of CAD.
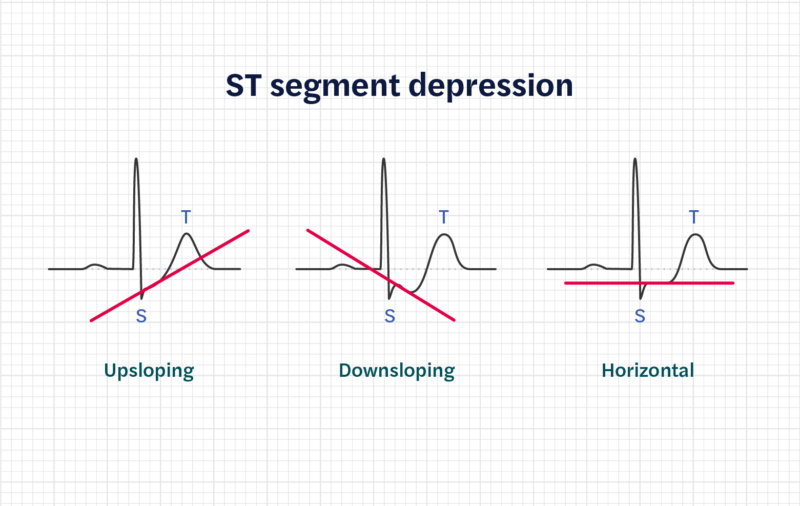
A downsloping ST depression may indicate coronary artery disease.
However, it’s important to note that a stress test is not a definitive diagnostic tool for CAD. It provides valuable information, but further testing and evaluation may be necessary to confirm a diagnosis. If significant ST-segment changes or other concerning findings occur during the stress test, your healthcare provider may recommend additional tests, such as a coronary angiography or a cardiac imaging study (e.g., myocardial perfusion imaging or stress echocardiography), to obtain a more comprehensive assessment of your heart’s condition.
When your doctor has arrived at a diagnostic conclusion, they will discuss the findings with you and outline a personalised treatment plan tailored to your specific condition and needs. This treatment plan may include lifestyle changes, medications, interventions, or further medical procedures if necessary.
Further reading
An ECG test is a powerful tool for assessing the state of a person’s heart. Alone, it delivers invaluable insights about heart rhythms and can indicate potential pathologies. Combined with other diagnostic measurements, it can provide deeper insights to ensure you receive a treatment plan specific to your needs. For more information, check out our full guide to ECG tests and read more about Seer Medical’s services. For more information about heart health, check out the Heart Foundation here.